N Wave Trend Continuation Trading System------------>Holy Grail
Posted: Wed Aug 23, 2023 9:47 am
N Wave Trend Continuation Trading System
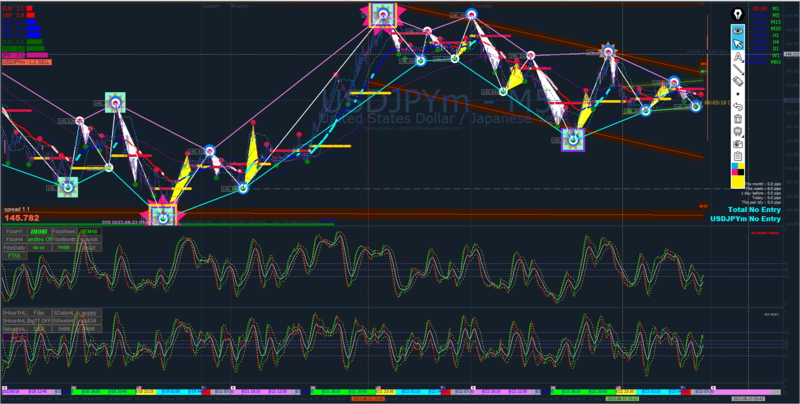
Entries:
 Only trade in the direction according to EMA55
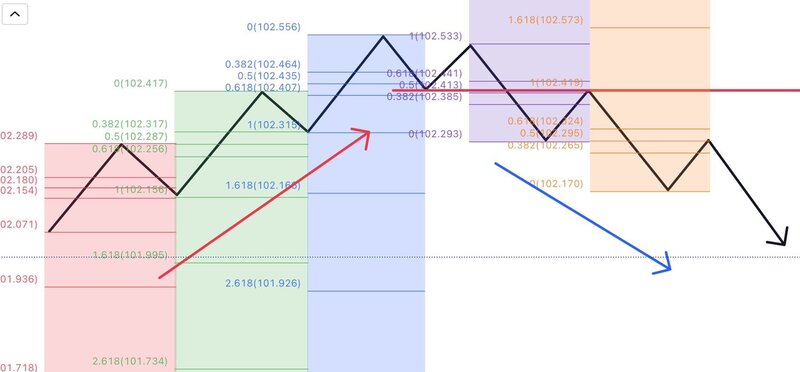
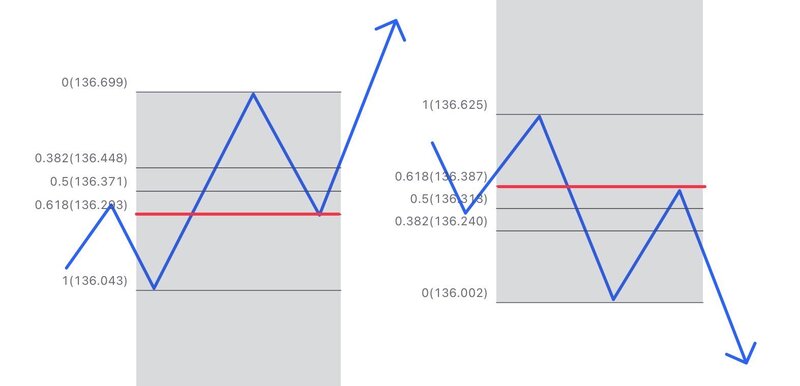
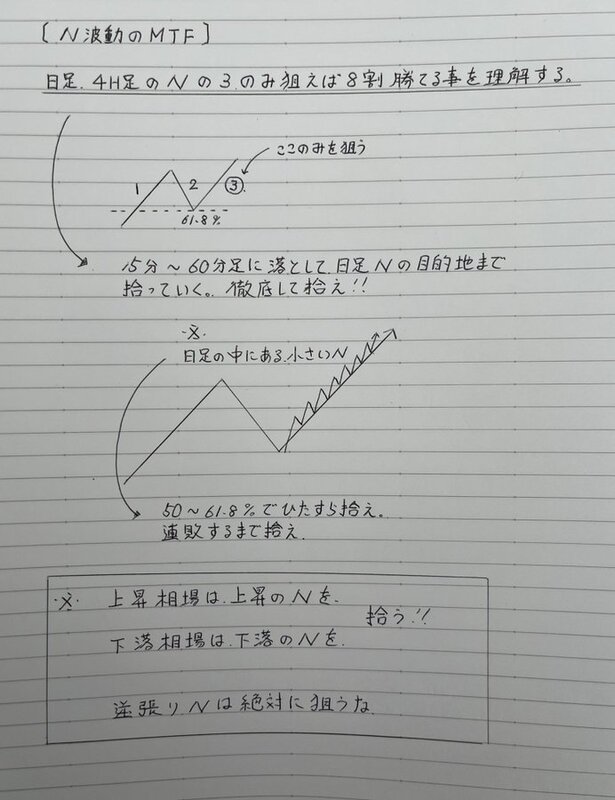
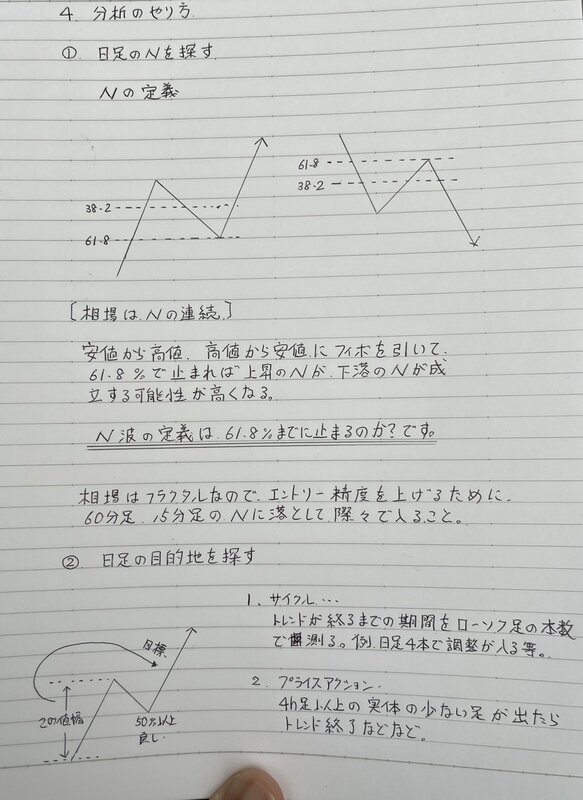
Only trade on 2nd dot (Fibo38.2, 61.8, N Wave)
Only if the slow rsi line is on or below the middle line of the bb look for the direction of the trade to trade
Only trade when the price is outside the Bollinger Bands 20/1
The price is above or below the H4 opening line
Must observe trading direction and market conditions from top to bottom
MN>W1>D1
D1>H4>H1
H1>M15>M5
M1 chart is best as an entry
____________________________________________________________________________________________________________________________________________________________________
Exiting:
Options
HTF's SLOW TDI line crosses the opposite direction of the BB middle line
HTF's RSX TDI Line crosses the opposite direction of the BB middle line
8/34 MA price crossing in the opposite direction
LTF price crosses opposite direction of 55MA
Price crosses previous high
Here it is suggested to trail the stop loss, set the stop loss in front of the trading point, and constantly modify the stop loss to the latest high or low point.
____________________________________________________________________________________________________________________________________________________________________
Filtering:
When the slow rsi market baseline exceeds 55 or 45, it means that the market is highly volatile
(Similarly, in the 55-45 range, it represents low volatility)
On the 55 line, whenever the slow rsi line crosses the bb middle line down, it indicates that the trend is slowing down or low volatility
On the 45 line, whenever the slow RSI line crosses the BB midline upwards, it indicates that the trend is slowing down or low volatility
When the rsx tdi line exceeds 68 lineor 32 line, it means high volatility
When the rsx tdi market baseline line crosses the 55 or 45 line, it means a trading opportunity
(trend occurrence or continuation)
(Invalid if it exceeds 55/45 during a period of price consolidation.
Looking at the lower times can see that the price is in the opposite direction.)
____________________________________________________________________________________________________________________________________________________________________
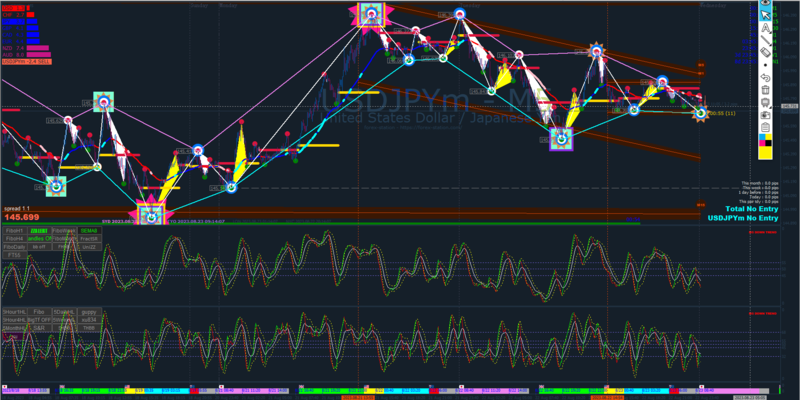
Updated Current Version
____________________________________________________________________________________________________________________________________________________________________
Entries:
 Only trade in the direction according to EMA55Only trade on 2nd dot (Fibo38.2, 61.8, N Wave)Only if the slow rsi line is on or below the middle line of the bb look for the direction of the trade to tradeOnly trade when the price is outside the Bollinger Bands 20/1The price is above or below the H4 opening lineMust observe trading direction and market conditions from top to bottom
MN>W1>D1
D1>H4>H1
H1>M15>M5
M1 chart is best as an entry
____________________________________________________________________________________________________________________________________________________________________
Exiting:
Options
HTF's SLOW TDI line crosses the opposite direction of the BB middle lineHTF's RSX TDI Line crosses the opposite direction of the BB middle line8/34 MA price crossing in the opposite directionLTF price crosses opposite direction of 55MAPrice crosses previous highHere it is suggested to trail the stop loss, set the stop loss in front of the trading point, and constantly modify the stop loss to the latest high or low point.
____________________________________________________________________________________________________________________________________________________________________
Filtering:
When the slow rsi market baseline exceeds 55 or 45, it means that the market is highly volatile(Similarly, in the 55-45 range, it represents low volatility)
On the 55 line, whenever the slow rsi line crosses the bb middle line down, it indicates that the trend is slowing down or low volatilityOn the 45 line, whenever the slow RSI line crosses the BB midline upwards, it indicates that the trend is slowing down or low volatilityWhen the rsx tdi line exceeds 68 lineor 32 line, it means high volatilityWhen the rsx tdi market baseline line crosses the 55 or 45 line, it means a trading opportunity (trend occurrence or continuation)
(Invalid if it exceeds 55/45 during a period of price consolidation.
Looking at the lower times can see that the price is in the opposite direction.)
____________________________________________________________________________________________________________________________________________________________________
Updated Current Version
____________________________________________________________________________________________________________________________________________________________________
