MT4 Analysis Tool for Evaluating Trades Using Chart Trendlines
Posted: Mon Feb 09, 2026 11:47 am
This tool displays backtest results.
This tool does not use the MT4 backtesting function.
It aggregates trendlines drawn on the chart.
Trendlines drawn manually as well as those drawn by indicators are included in the aggregation.
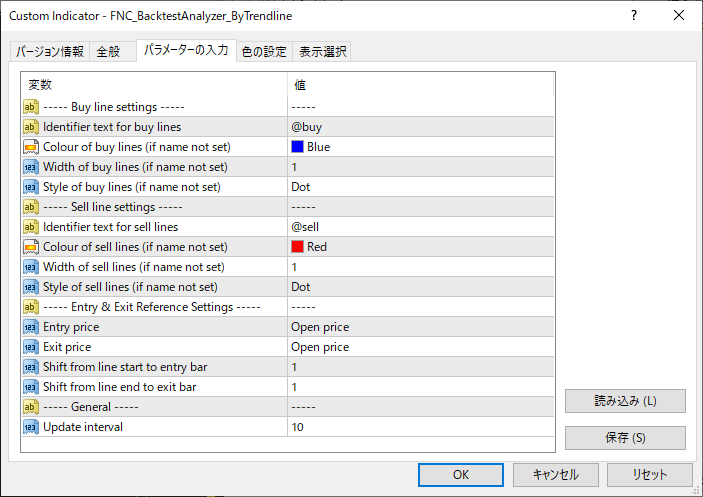
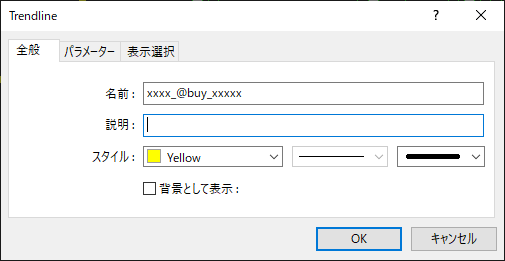
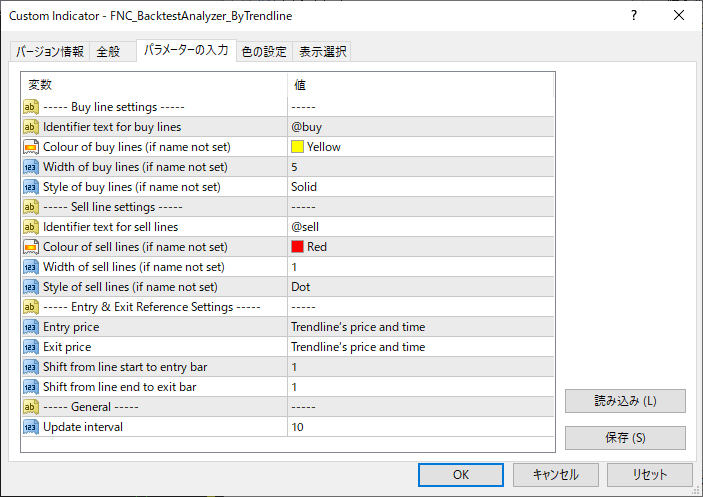
Trade direction (sell or buy) is identified based on the object name or the object’s attributes, such as colour, thickness, or type.
The price reference point can be set to the open, the close, or the trendline drawing position.
The time reference point can be set to the trendline drawing position or by specifying a time shift.
The following information is displayed.
Number of trades and win rate, broken down by sell / buy / total and by wins / losses
Pips and risk–reward ratio, broken down by sell / buy / total and by wins / losses
Aggregation period (number of days / weeks / months), average weekly pips, and average monthly pips
In all cases, pips are calculated as Point divided by 10.
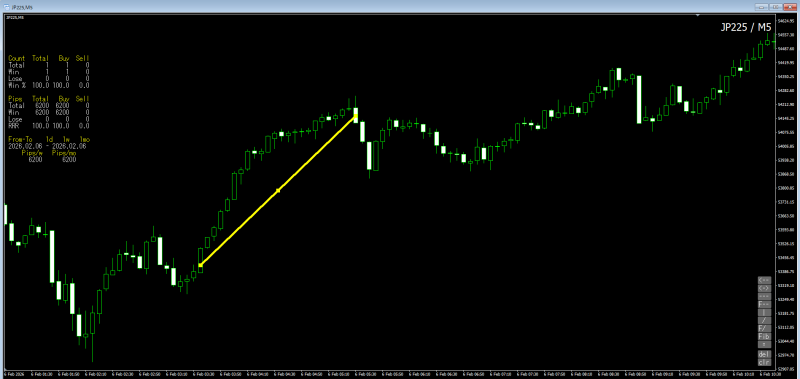
Aggregation examples
An example where the object name is used and the period from the open of the next bar to the open of the following bar is applied.
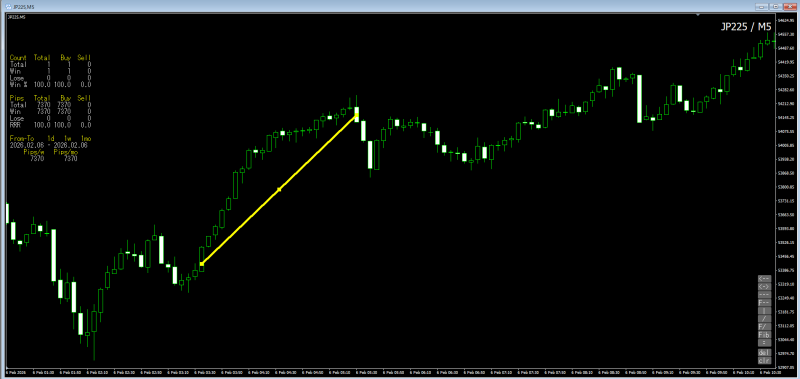
An example where object attributes are used and the period from the trendline drawing position to the trendline drawing position is applied.

This tool does not use the MT4 backtesting function.
It aggregates trendlines drawn on the chart.
Trendlines drawn manually as well as those drawn by indicators are included in the aggregation.
Trade direction (sell or buy) is identified based on the object name or the object’s attributes, such as colour, thickness, or type.
The price reference point can be set to the open, the close, or the trendline drawing position.
The time reference point can be set to the trendline drawing position or by specifying a time shift.
The following information is displayed.
Number of trades and win rate, broken down by sell / buy / total and by wins / losses
Pips and risk–reward ratio, broken down by sell / buy / total and by wins / losses
Aggregation period (number of days / weeks / months), average weekly pips, and average monthly pips
In all cases, pips are calculated as Point divided by 10.
Aggregation examples
An example where the object name is used and the period from the open of the next bar to the open of the following bar is applied.
An example where object attributes are used and the period from the trendline drawing position to the trendline drawing position is applied.