From Mladen Rakic:
Theory
The indicator is based on Akram El Sherbini's article "Time Cycle Oscillators" published in IFTA journal 2018 (attached below).
The SHO is a bounded (Normalized) oscillator for the simple harmonic index that calculates the period of the market’s cycle. The oscillator is used for short and intermediate terms and moves within a range of -100 to 100 percent. The SHO has overbought and oversold levels at +40 and -40, respectively. At extreme periods, the oscillator may reach the levels of +60 and -60. The zero level demonstrates an equilibrium between the periods of bulls and bears. The SHO oscillates between +40 and -40. The crossover at those levels creates buy and sell signals. In an uptrend, the SHO fluctuates between 0 and +40 where the bulls are controlling the market. On the contrary, the SHO fluctuates between 0 and -40 during downtrends where the bears control the market. Reaching the extreme level -60 in an uptrend is a sign of weakness. Mostly, the oscillator will retrace from its centerline rather than the upper boundary +40. On the other hand, reaching +60 in a downtrend is a sign of strength and the oscillator will not be able to reach its lower boundary -40.
Usage
- Centerline Crossover Tactic
- This tactic is tested during uptrends. The buy signals are generated when the WPO/SHO cross their centerlines to the upside. The sell signals are generated when the WPO/SHO cross down their centerlines. To define the uptrend in the system, stocks closing above their 50-day EMA are considered while the ADX is above 18.
- Uptrend Tactic
- During uptrends, the bulls control the markets, and the oscillators will move above their centerline with an increase in the period of cycles. The lower boundaries and equilibrium line crossovers generate buy signals, while crossing the upper boundaries will generate sell signals. The “Re-entry” and “Exit at weakness” tactics are combined with the uptrend tactic. Consequently, we will have three buy signals and two sell signals.
- During sideways, the oscillators fluctuate between their upper and lower boundaries. Crossing the lower boundary to the upside will generate a buy signal. On the other hand, crossing the upper boundary to the downside will generate a sell signal. When the bears take control, the oscillators will cross down the lower boundaries, triggering exit signals. Therefore, this tactic will consist of one buy signal and two sell signals. The sideway tactic is defined when stocks close above their 50-day EMA and the ADX is below 18.
Mladen's MT5 version
cb__49.png
example__77.png
SHO.mq5
MT4 version with All Averages
EURUSDM15.png
! SHO avgs.ex4
Akram El Sherbini's article from 2018 - Time Cycle Oscillators
Time Cycle Oscillators - Akram El Sherbini 2018.pdf
Could it be possible mtf version?
Statistics: Posted by ffsss — Thu May 23, 2024 2:39 am — Replies 1286 — Views 520500
]]>
If Windows 10 support actually terminates in 2025, I'm switching to Linux Mint which is compatible with MT5 (https://www.mql5.com/en/articles/625?).
Statistics: Posted by JohnnyRy — Thu May 23, 2024 2:33 am — Replies 56 — Views 2117
]]>
Statistics: Posted by mrtools — Thu May 23, 2024 2:30 am — Replies 784 — Views 333423
]]>
Statistics: Posted by REDntense — Thu May 23, 2024 2:18 am — Replies 103 — Views 11435
]]>
"Donald Trump’s hush-money trial has drawn quite a few of his high-profile supporters, including members of Congress and those hoping to be his vice presidential running mate. Among them also happens to be a onetime leader of the Hells Angels gang.
Chuck Zito, who helped to found the New York Nomads chapter of the outlaw motorcycle gang, was among Trump’s entourage on Monday at the Manhattan courthouse where his trial is being held.
Zito has a criminal record, serving prison time from 1985 to 1998 for drug conspiracy charges. His chapter of the Hells Angels has also been linked to the Gambino Mafia crime family. And the Justice Department considers Hells Angels to be an organized crime syndicate.
Why would Trump want him at his trial in New York? Zito doesn’t have a political career. These days, he’s more famous for his occasional acting. However, The New York Times points out that Trump has an old association with bikers going back to his 2016 campaign, when he addressed a Washington, D.C., biker rally. There’s even a Bikers for Trump group, which took part in several Trump rallies alleging that the 2020 election was stolen.
Zito isn’t the only Trump supporter with a criminal record who appeared at the courtroom on Monday: Former New York Police Department Commissioner Bernard Kerik, who went to prison on tax charges and was later pardoned by Trump, also showed up for moral support.
And while Zito’s mob ties might appear bad on the surface, Trump has ties to organized crime himself going back decades. Legal experts have expressed concern for the safety of jurors in Trump’s trials. And the former president has even been accused of using “an obvious Mafia tactic” to get around his gag order in the case by having his supporters speak for him. Zito’s attendance in many ways is a boost to Trump’s ego: He has an infamous tough guy show up in his corner at a trial that could send him to prison.
The Republican presidential nominee is facing 34 felony charges for allegedly falsifying business records with the intent to further an underlying crime by using his former fixer, Michael Cohen, to pay off adult film actress Stormy Daniels to cover up an affair before the 2016 election. He has pleaded not guilty to all charges."
(https://www.yahoo.com/news/trump-newest ... 11542.html)
Statistics: Posted by JohnnyRy — Thu May 23, 2024 1:34 am — Replies 241 — Views 9480
]]>
thank you so much
I'm really sorry. accept my apology
I forgot to write in the previous request that make the indicator multi-time frame. and on / off buttom .
I would appreciate it if you could do it whenever you have time.
! Smoothed tenkan sen kijun sen filled (mtf + alerts + arrows).ex4Downloaded 15 times 350.79 KiB
Statistics: Posted by mrtools — Thu May 23, 2024 12:59 am — Replies 526 — Views 243783
]]>
Sometimes price not down and go sideaway.or little down.
This condition indicators is down.
That is prices collecting power.
Here rsi down and indicator give buy signal ,on aggressive trends this is best indicator.
Statistics: Posted by guner — Thu May 23, 2024 12:33 am — Replies 1233 — Views 96500
]]>
Statistics: Posted by Banzai — Thu May 23, 2024 12:25 am — Replies 707 — Views 62341
]]>
Indicator : HalfTrend MTF,NRP TT x5v7 mod k
This is basically ma cross atr
I think every ma cross redraw
2 factor
3 ma
Is about the best you get
Statistics: Posted by WOLF — Thu May 23, 2024 12:12 am — Replies 452 — Views 219628
]]>
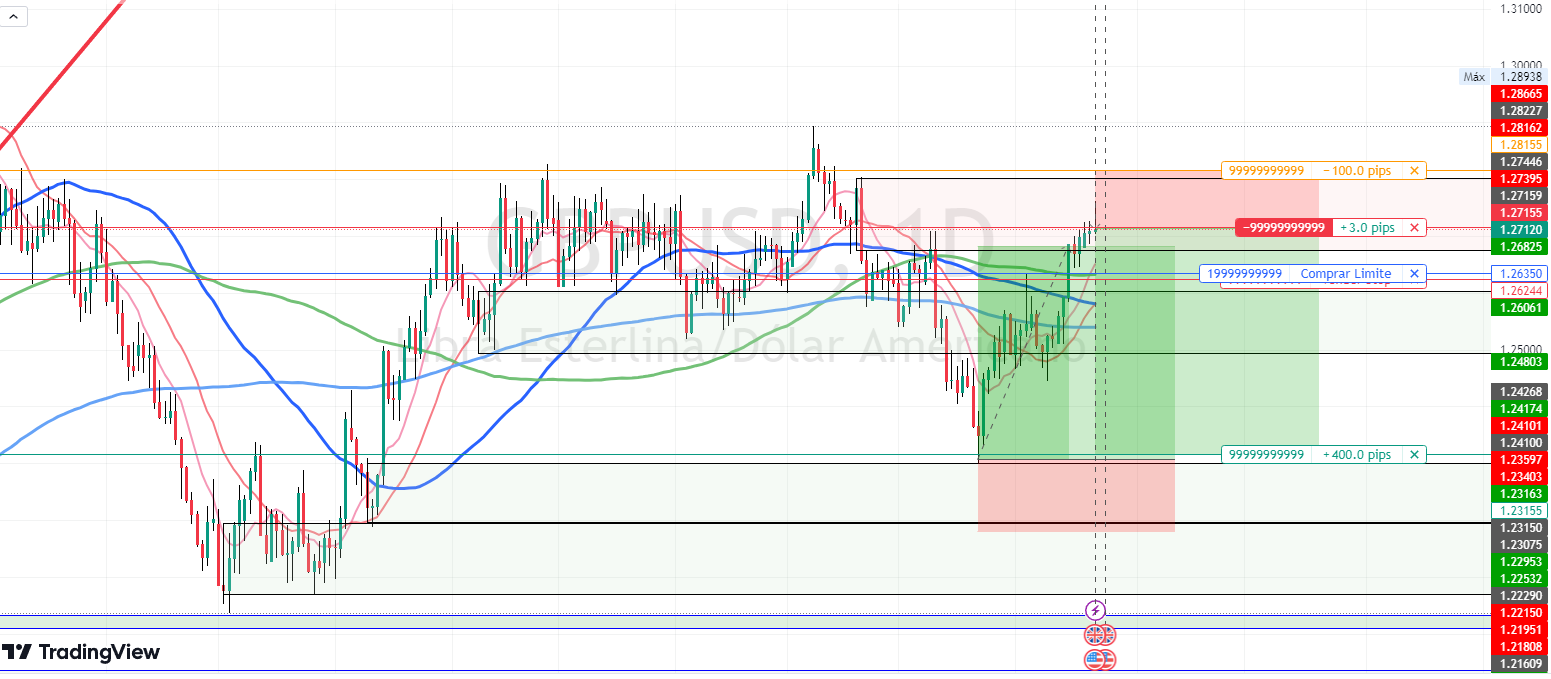
 GBPUSD: #22052024
 SELL: 1.2715
 TP 1: 1.2635TP 2: 1.2315
 SL : 1.2815
 GET $30 FREE to Trade. NO Deposit required (just verify your account): https://bit.ly/xm30free
 You can follow this trade result here: t.me/ictradersbrasil
Statistics: Posted by ICTradersBrasil — Wed May 22, 2024 9:40 pm — Replies 11 — Views 954
]]>
Statistics: Posted by ionone — Wed May 22, 2024 9:29 pm — Replies 20462 — Views 5222433
]]>
]]>
Mrtools has introduced an enhanced All Averages MT4 version of Mladen's Simple Harmonic Oscillator. This tool, based on the simple harmonic equation & including Variable Period & Total Period elements, is designed for short-term trading strategies. D/L: post1295542148.html#p1295542148
Statistics: Posted by Jimmy — Wed May 22, 2024 7:57 pm — Replies 1933 — Views 1673535
]]>
4 hours ·
The total combat losses of the enemy from 24.02.22 to 22.05.24 were approximately:
personnel / about 496370 (+1300) persons / persons,
tanks ‒ 7611 (+6) units,
armored fighting vehicles / APV ‒ 14721 (+22) units,
artillery systems – 12,820 (+41) units,
RSZV / MLRS – 1077 (+0) units,
anti-aircraft warfare systems ‒ 812 (+1) units,
aircraft – 354 (+0) units,
helicopters – 326 (+0) units,
UAV operational-tactical level – 10346 (+56),
cruise missiles ‒ 2208 (+1),
ships / boats / warships / boats ‒ 27 (+0) units,
submarines - 1 (+0) units,
vehicles and fuel tanks – 17442 (+59) units,
special equipment / special equipment ‒ 2090 (+5)
Statistics: Posted by vvFish — Wed May 22, 2024 7:01 pm — Replies 2870 — Views 176372
]]>
Code: Select all
The original rules were clear:-Compute the rolling mean of High minus Low over the last 25 days;-Compute the IBS indicator: (Close - Low) / (High - Low);-Compute a lower band as the rolling High over the last 10 days minus 2.5 x the rolling mean of High mins Low (first bullet);-Go long whenever SPY closes under the lower band (3rd bullet), and IBS is lower than 0.3;-Close the trade whenever the SPY close is higher than yesterday's high.The logic behind this trading strategy is that the market tends to bounce back once it drops too low from its recent highs.The results shown above are from an improved strategy: better exit rule with dynamic stop losses. I created a full write-up with all its details herehttps://www.reddit.com/r/algotrading/co ... 11_sharpe/
Statistics: Posted by ionone — Wed May 22, 2024 6:51 pm — Replies 0 — Views 100
]]>