Page 1 of 3

Bollinger Bands Indicators for MT5

Posted: Fri Apr 15, 2022 8:52 pm
by ionone
here is Inverse BB for MT5 now
Jeff

Re: Bollinger Bands Indicators for MT5

Posted: Fri Apr 29, 2022 4:42 am
by Banzai
Moving Average Bands - extended (on/off button)

Re: Bollinger Bands Indicators for MT5

Posted: Tue May 17, 2022 2:54 am
by mrtools
Hello

I forgot to attach it, I wish there was an arrow.
There are parts that I have not corrected, thank you. :razz:
Added arrows.

Re: Bollinger Bands Indicators for MT5

Posted: Thu Jun 23, 2022 1:40 pm
by 太虚一毫
mrtools wrote: Tue May 17, 2022 2:54 am Added arrows.
Image


When the teacher has free time, please change these two indicators: :thumbup:

1. Change the Candles core thickness to 2, and the Candles body thickness to 4.

2. Add an alarm: clrMagenta, clrAqua, the two color Candles will be alarmed once when they appear.

#property indicator_color1 clrMagenta,C'255,0,0',C'233,0,0',C'188,0,0',C'144,0,0',CLR_NONE,C'0,144,0', C'0,188,0',C'0,233,0',C'0,255,0',clrAqua

3. Try adding ADXVMA to the indicator.

Re: Bollinger Bands Indicators for MT5

Posted: Thu Jun 23, 2022 3:42 pm
by Jedidiah

Mohsen khashei

This is Bollinger Bands %b indicator for MetaTrader 5.

It is all about the relationship between price and the Upper and Lower Bands. There are six basic relationships that can be quantified.

In descending order from the Upper Band:

%B Above 1 = Price is Above the Upper Band;
%B Equal to 1 = Price is at the Upper Band;
%B Above .50 = Price is Above the Middle Line;
%B Below .50 = Price is Below the Middle Line;
%B Equal to 0 = Price is at the Lower Band;
%B Below 0 = Price is Below the Lower Band.
Generally speaking .80 and .20 are also relevant levels:

%B Above .80 = Price is Nearing the Upper Band;
%B Below .20 = Price is Nearing the Lower Band.

Re: Bollinger Bands Indicators for MT5

Posted: Thu Jun 23, 2022 4:26 pm
by Jedidiah
The indicator draws (in a separate window) the Bollinger Bands ® relative to the moving average and projection of the price bars.

The drawing looks like a pulse.

Re: Bollinger Bands Indicators for MT5

Posted: Thu Jun 23, 2022 4:37 pm
by Jedidiah
The indicator plots the Bollinger Bands ®, filled with different colors depending on the trend direction.

If the price crosses the upper bound (upward trend), the Bollinger Bands fills with blue color, if it crosses the lower bound (downward trend), the Bands filled with pink color.

If the price crosses the middle line, it's considered as a flat, and the Bands filled with grey color.

Re: Bollinger Bands Indicators for MT5

Posted: Thu Jun 23, 2022 5:16 pm
by 太虚一毫
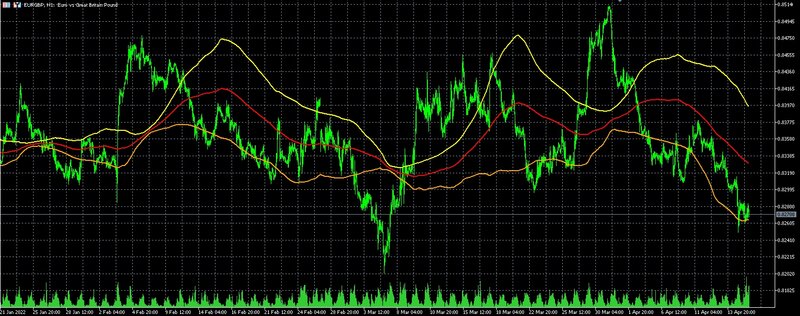
honje19960321 wrote: Thu Jun 23, 2022 4:37 pm The indicator plots the Bollinger Bands ®, filled with different colors depending on the trend direction.

If the price crosses the upper bound (upward trend), the Bollinger Bands fills with blue color, if it crosses the lower bound (downward trend), the Bands filled with pink color.

If the price crosses the middle line, it's considered as a flat, and the Bands filled with grey color.
Image
ibbfill2.mq5


This is the work of Dmitry Fedoseev.

The indicator plots the Bollinger Bands ®, filled with different colors depending on the trend direction.

If the price crosses the upper bound (upward trend), the Bollinger Bands fills with blue color, if it crosses the lower bound (downward trend), the Bands filled with pink color.

If the price crosses the middle line, it's considered as a flat, and the Bands filled with grey color.

Input parameters:

BBPeriod - Bollinger Bands period;
BBDeviation - Bollinger Bands width (in deviations);
BBPrice - Bollinger Bands applied price.


If the midline is changed to ADXVMA , or the midline is changed to Step . is a good indicator!

Re: Bollinger Bands Indicators for MT5

Posted: Thu Jun 23, 2022 5:32 pm
by Jedidiah
Sergey Pavlov

Bollinger bands at Fibonacci levels - indicator for MetaTrader 5

The indicator uses the standard iBands indicator.

Bollinger Bands are constructed based on extended Fibonacci levels.

Re: Bollinger Bands Indicators for MT5

Posted: Sat Jun 25, 2022 12:40 am
by Jedidiah
Kaijun Wang

Bollinger Bands Advanced Edition For 5

Advanced Bollinger Bands:

1. The Bollinger rail will change color with the direction"

2. The expansion and contraction of the Bollinger outer rail will be marked with a color change on the outer rail"
3. The calculation method of Bollinger Middle Orbit can choose any moving average, such as EMA"
4. You can also choose any price application mode for calculation"

Bollinger Band is a very practical technical indicator designed according to the standard deviation principle in statistics. It consists of three orbital lines, of which the upper and lower lines can be regarded as price pressure lines and support lines respectively. Between the two lines is an average price line. Generally, the price line is in the band-shaped interval composed of upper and lower rails. Walk around, and automatically adjust the position of the track as the price changes. When the wave band narrows, fierce price fluctuations may occur immediately; if the high and low points cross the band edge and immediately return to the wave band, a retracement will occur.