383 / 5.000
I just want to do the following, when the buy and sell arrow appears on my scalp indicator, I want to look at the xard system and know if it makes sense for me to do the operation or not (based on the current trend in m1 xauusd)
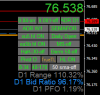
I know I should look at the histogram because it doesn't repaint, but what else can I see to help confirm the arrow,
Can anyone suggest something to help me?
In the previous photo, the round blue arrow was accompanied by the thick blue line, and now it has repainted and returned to selling with the thick red line...
Having reached this conclusion, perhaps I should ignore this second arrow and just follow the main bias and the histogram to align my entry arrows,
XARD: And what does the 15 minute TF tell you?
Attachments forums
Re: XARD - Simple Trend Following Trading System
1337br, Wed May 28, 2025 11:16 pm

 Clarity before taking action. After weeks of fo