Does anyone know the indicator name that plots the red and the green arrow at the edge of the candles?
Attachments forums
Re: Identify This Indicator
tannos, Wed Nov 25, 2020 9:39 pm
Hi
Does anyone know the indicator name that plots the red and the green arrow at the edge of the candles?
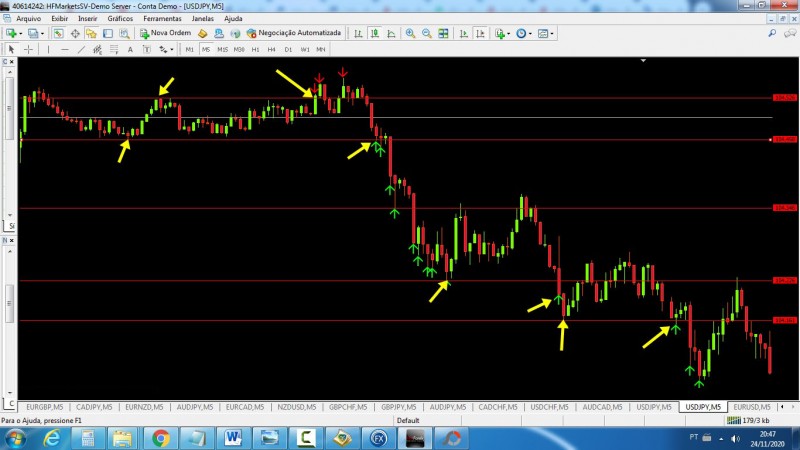 This is an exhaustion indicator, it usually touches a maximum or minimum of the price, a region of support and resistance, a top or bottom, this arrow appears, say, for example, it touched a bottom, a arrow appears, another candle came this same bottom or breaking, another arrow appears
Does anyone know the indicator name that plots the red and the green arrow at the edge of the candles?


