Description by author :
The Multi Forex Scanner indicator is a MT4 indicator that I developed because I wanted to save time finding good pairs to trade.
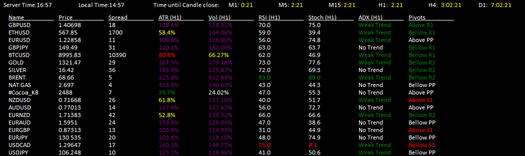
It shows the list of currencies available in the Market Watch window. If you wish to hide any currency, just hide it in the Market Watch.
I hope it helps you.
Settings
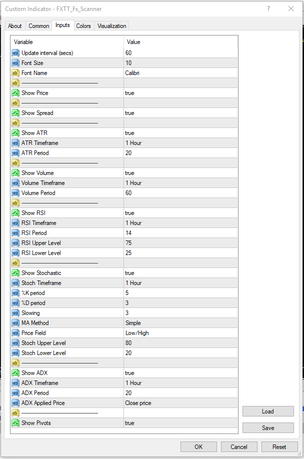
Update interval (secs) – Allows you to define the interval in which the indicator is updated. This is to prevent performance issues.
Font Size – Allows you to define the font size of the text shown on screen.
Font Name – Allows you to define the font of the text shown on screen.
—————————————————
Show Price – Show/Hide the Price column. This column shows the Bid of the currency.
—————————————————
Show Spread – Show/Hide the Spread column. This column shows the Spread of the currency.
—————————————————
Show ATR – Show/Hide the ATR column. This column shows the percent of the current bar in relation to the calculation of the ATR.
ATR Timeframe – The timeframe to use in the ATR calculation.
ATR Period – The period to use in the ATR calculation.
—————————————————
Show Volume – Show/Hide the Volume column. This column shows the percent of the current bar volume in relation to the average of the previous volumes.
Volume Timeframe – The timeframe to use in the calculation of the average volume.
Volume Period -The period to use in the calculation of the average volume.
—————————————————
Show RSI – Show/Hide the RSI column. This column show the RSI for the current bar. If the RSI is overbought the data is green. If the RSI is oversold, the data is red.
RSI Timeframe – The timeframe of the RSI calculation
RSI Period – The period of the RSI
RSI Upper Level – The upper level of the RSI. Allows to detect overbought.
RSI Lower Level – The lower level of the RSI. Allows to detect oversold.
—————————————————
Show Stochastic – Show/Hide the Stoch column. This column shows the Stochastic value for the current bar.
Stoch Timeframe – The timeframe of the Stochastic calculation.
%K period – The %K parameter of the Stochastic.
%D period – The %D parameter of the Stochastic.
Slowing – The Slowing of the Stochastic.
MA Method – The Moving Average method of the Stochastic.
Price Field – The Price Field parameter of the Stochastic.
Stoch Upper Level– The upper level of the Stochastic. Allows to detect overbought.
Stoch Lower Level– The lower level of the Stochastic. Allows to detect oversold.
—————————————————
Show ADX – Show/Hide the ADX column. This column interprets the value of the ADX according to the levels 25, 50 and 75.
ADX Timeframe – The timeframe used in the calculation of the ADX.
ADX Period – The period of the ADX.
ADX Applied Price – The applied price of the ADX.
—————————————————
Show Pivots – Show/Hide the Pivots column. This column displays the position of price in relation to the closest pivot level.
—————————————————
Show MA – Show/Hide the MA column. This column shows if price is above or below the configured moving average
MA Timeframe – The timeframe used in the calculation of the MA.
MA Period – The period of the MA.
MA Method – The method of the MA.
MA Applied Price – The applied price of the MA.
