donut4popodonut4popo wrote:Thanks for your time. Better pic attached. If I move it any further left its at 1255 hrs. Wilders DMI data matches.
0 11:36:10.809 2017.03.03 13:05:00 testing wave60pips v0.9.20 EURUSDpro,M5: WDMIplus = 38.17922323789519
0 11:36:10.809 2017.03.03 13:05:00 testing wave60pips v0.9.20 EURUSDpro,M5: WDMIminus = 8.951059946685866
0 11:36:10.809 2017.03.03 13:05:00 testing wave60pips v0.9.20 EURUSDpro,M5: WDMIstr = 51.08961671907988
0 11:36:10.809 2017.03.03 13:05:00 testing wave60pips v0.9.20 EURUSDpro,M5: DSLRSX_Upper = 64.85339350325245
0 11:36:10.809 2017.03.03 13:05:00 testing wave60pips v0.9.20 EURUSDpro,M5: DSLRSX_Lower = 46.24607009518671
0 11:36:10.809 2017.03.03 13:05:00 testing wave60pips v0.9.20 EURUSDpro,M5: DSLRSX_Signal = 70.96818777439421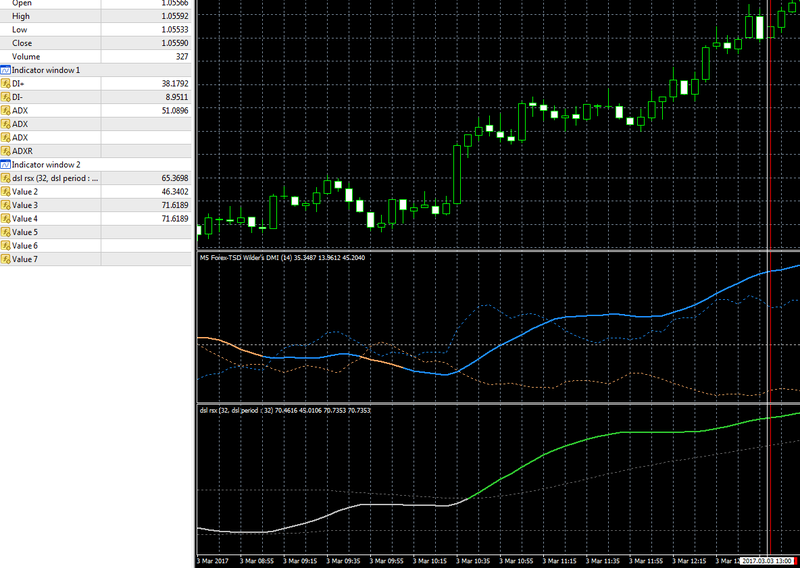
You can not do that. You must hover with mouse over the exact bar that you want to see the values for (that you are testing from iCustom() call). Believe me : there is no problem with iCustom() call or with the indicator.